Portugal was in 2011, according to the S80/S20 measure, the sixth country from EU with the highest level of income inequality. In comparison with 2010, the country rose one place in this unwanted podium.
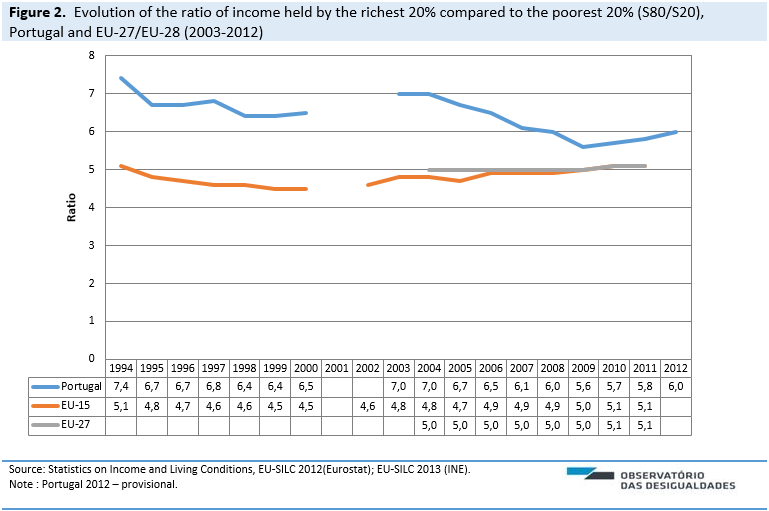
The S80/S20 is a “percentile ratio” calculated as the ratio of total income received by the 20% of the population with the highest income to that received by 20% with a lowest income level.
In 2011, the disposable income of the richest 20% in Portugal (the top quintile) was 5,8 higher than the income of the poorest 20% (the bottom quintile). Considering the set of European countries analysed in Figure 1, Spain had the highest value of this measure (7,2), just followed by Greece (6,6), Latvia (6,5) and Romania (6,3). Norway (3,2), Iceland and Slovenia (both with 3,4) are the countries that present the lowest levels of income inequalities between the two quintiles.

Figure 2 provides information about the evolution of S80/S20 in Portugal and Europe (EU-15 and EU-27). In Portugal, the year of 1994 marks the peak of economic inequality in the time series. The S80/S20 then decreases in the second half of this decade. Between 2004 and 2009 there was a sustained inequality reduction, but we observe a changing trend in the last years. Since 2010, the ratio between the richest 20% and poorest 20% increased every year, aggravating this measure in 0,3 percentage points.
The value for Portugal is always higher than the EU-27 – and in the last years has increased again. In the EU-27 the average of S80/S20 remained stationary in the period 2004 – 2011.

Updated by: Ana Rita Matias
