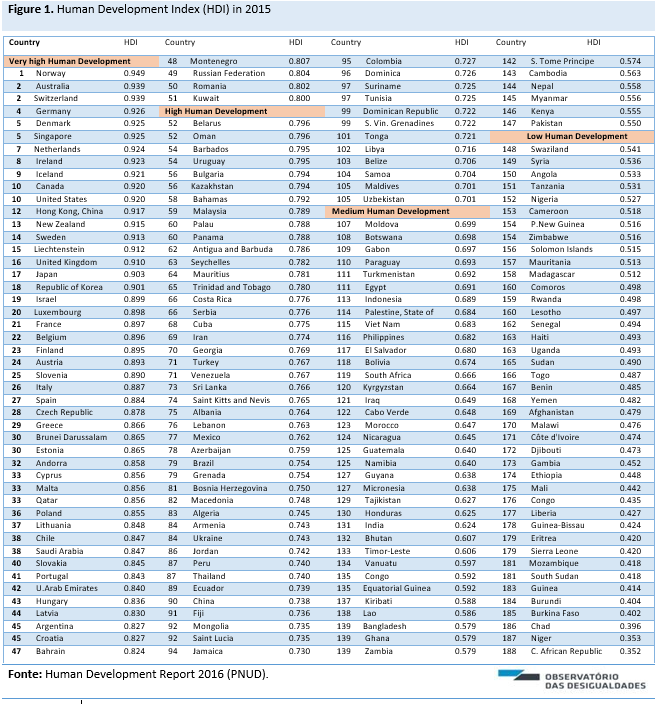
In 2015, Africa continues to show the lowest Human Development index among the other regions of the globe. In the southern hemisphere the countries with medium or low human development level predominate, whereas in the northern hemisphere almost every country achieves a high or very high score.
In the set of countries with a low Human Development Index (HDI), 8 in every 10 are Africans (Figure 1). The three countries with lowest human development index are Chad (0.396), Niger (0.353) and Central African Republic (0.352). Among the Portuguese-speaking African countries (PALOP), Mozambique (0.418), Guinea-Bissau (0.424) and Angola (0.533) are, the 8th, 11th and 39th countries, respectively, with a lower HDI. Cabo Verde (0.648) and Sao Tome and Principe (0.574) are part of the group with medium HDI.

Most of the OECD countries and all of the UE-28 have a very high HDI (>0,80 points), its Norway (0.949) followed by Australia and Switzerland (with an HDI of 0.939 points), that present the highest values of development measured by this indicator.
Among the countries of the EU-28, twelve have superior development levels than the average value of the very high HDI (>0.892, cf. Figure 2) – Austria, Finland, Belgium, France, Luxemburg, United Kingdom, Sweden, Ireland, Netherlands, Denmark, and Germany.
Among the 51 countries with very high human development index and the total of 188 countries and territories, Portugal is in the 41º position in the ranking, with a value of 0.843 in 2015. Between 2010 and 2015, the country ascended one position in the HDI ranking.

The figure 2, compares the values of the Human Development Index and its components between 1990 and 2015, by development levels and world regions. Along the last 25 years, the HDI of the world´s mean increased 0.12 points from 0.597 to 0.717 (an annual increase of 0.74%).
There are still notorious differences among the levels of development and regions in what regards to the HDI components: life expectancy at birth, expected years of schooling, mean years of schooling, and Gross National Income (GNI) per capita.
Note that, for example, the mean of the Gross National Income (GNI) per capita among the countries with a very high HDI (39,605 PPP$) is almost 15 times superior to the registered value in the countries with low HDI (2,649 PPP$), and the life expectancy at birth (79.4 years) is around to 20 years superior (59.3 years). In what regards to the expected years of schooling, it is estimated that in countries with a low HDI, is approximately 7 years inferior when compared with a very high HDI.
In none of the regions defined by the Human Development Report is found an HDI considerate “very high” (0.800 or above) (Figure 2): Europe and Central Asia is the region with highest development level (0,756) and, Latin America and the Caribbean (0.751), together with East Asia and the Pacific (0.720), are part of the HDI considerate “high” (0.700-0,799). The HDI value of South Asia (0.621) and the Arab States (0.687) correspond to a medium HDI (0.550-0.699). In the report published by the United Nation (2017), it is mentioned that South Asia was the region that, between 1990 and 2015, had, in average, the highest growth (1.4% per year). Finally, Sub-Saharan Africa (0.523) is the only region that presents a “low” HDI (less than 0.550).

The figure 3 presents the evolution of the HDI and components, in Portugal, between 1900 and 2015. In the last 25 years, the Portuguese HDI rose 0.132 points (an average annual growth of 0.68%). The period between 1990 and 2000, registers the moment with more growth in this indicator (average of 0.97% per year), what reveals an improvement in the various components. However, since 2010, there has been a smaller evolution of the values of the HDI (in mean, 0.59% per year), partly explained by the effect of the GNI per capita (specifically between 2010 and 2012).
Since 1990, the life expectancy at birth in Portugal increased 6.9 years (in 2015 stands at 81.2), the mean years of schooling increased in 2.7 years (in 2015, it was of 8.9 years) and the expected years of schooling in 4.8 years (in 2015, 16.6 years). Finally, the Portuguese Gross National Income (GNI) per capita (PPP$) raised approximately 29% in the last 25 years (from 20,223 PPP% to 26,104 PPP$). Portugal continues to be clearly distant from the rest of the countries with a very high HDI, particularly in the mean years of schooling and GNI per capita.
Updated by: Ana Rita Matias and Andrea Oceguera Farías

